Where the Capital Isn't: Europe's Technology Sovereignty Map vs. Its Funding Map
The two-minute read
We built a critical-path map of where Europe's strategic technology stack actually constrains. Six chains: power, semiconductors, storage, industrial robotics and automation, post-quantum cryptography, and conformity testing. A tight filter on priority, duration, and severity surfaces the hardest constraints in each.
Three findings.
One. The European funding instruments and the European bottlenecks are pointing in different directions. The Chips Act, the AI Factories programme, the Quantum Act, and the European Grids Package concentrate on parts of the stack where Europe already leads (lithography, grid power, specialty substrates). The hardest bottlenecks sit elsewhere.
Two. Across the EU Tech Sovereignty corpus, deployment friction outweighs supply scarcity in every chain. The count of nodes blocked by regulation, certification, qualification, market design, or governance rules exceeds the count blocked by physical supply in every chain. In post-quantum cryptography, the deployment-gated count runs more than thirteen times the qualified-supply-bottleneck count. Capacity exists. The rails to deploy it do not.
Three. Inside those 53 bottlenecks sit a smaller number of bundles where deployment-gate resolution and supply-capacity expansion compound. The action shape inside each bundle differs: capacity license, channel partnership, regulatory shaping, M&A, direct equity. Six are sufficiently developed that we are operating against them now. We do not name them in this article.
If your mandate touches European tech sovereignty allocation, what follows answers one question: are you funding where Europe already leads, or where Europe is actually stuck? The two maps do not overlap. The bundles do.
Who controls what: Supply-constraint technology bottlenecks create leverage. Owning them creates sovereignty.
I. The map is not the map
European tech sovereignty has become one of the most heavily funded ideas in policy. The Chips Act. Chips Act 2.0. InvestAI Gigafactories. AI Factories. Cloud & AI Development Act. The Quantum Act. The European Grids Package. The AI Act. The Digital Networks Act. The 28th Regime. Capital is moving.
The map of where capital is moving and the map of where the constraints sit are different maps.
Over the past year, my colleagues and I built a critical-path map across six strategic value chains underwriting Europe's digital and industrial infrastructure: power, semiconductors, storage, industrial robotics and automation, post-quantum cryptography, and conformity testing. The first five chains form the EU Tech Sovereignty core corpus. Six hundred and eighty-four candidate bottlenecks. A tight filter on priority, duration, and severity surfaces fifty-three. The sixth chain, industrial robotics and automation, is mapped against adjacent evidence: the Physical AI value-chain corpus and the public acquisition record.
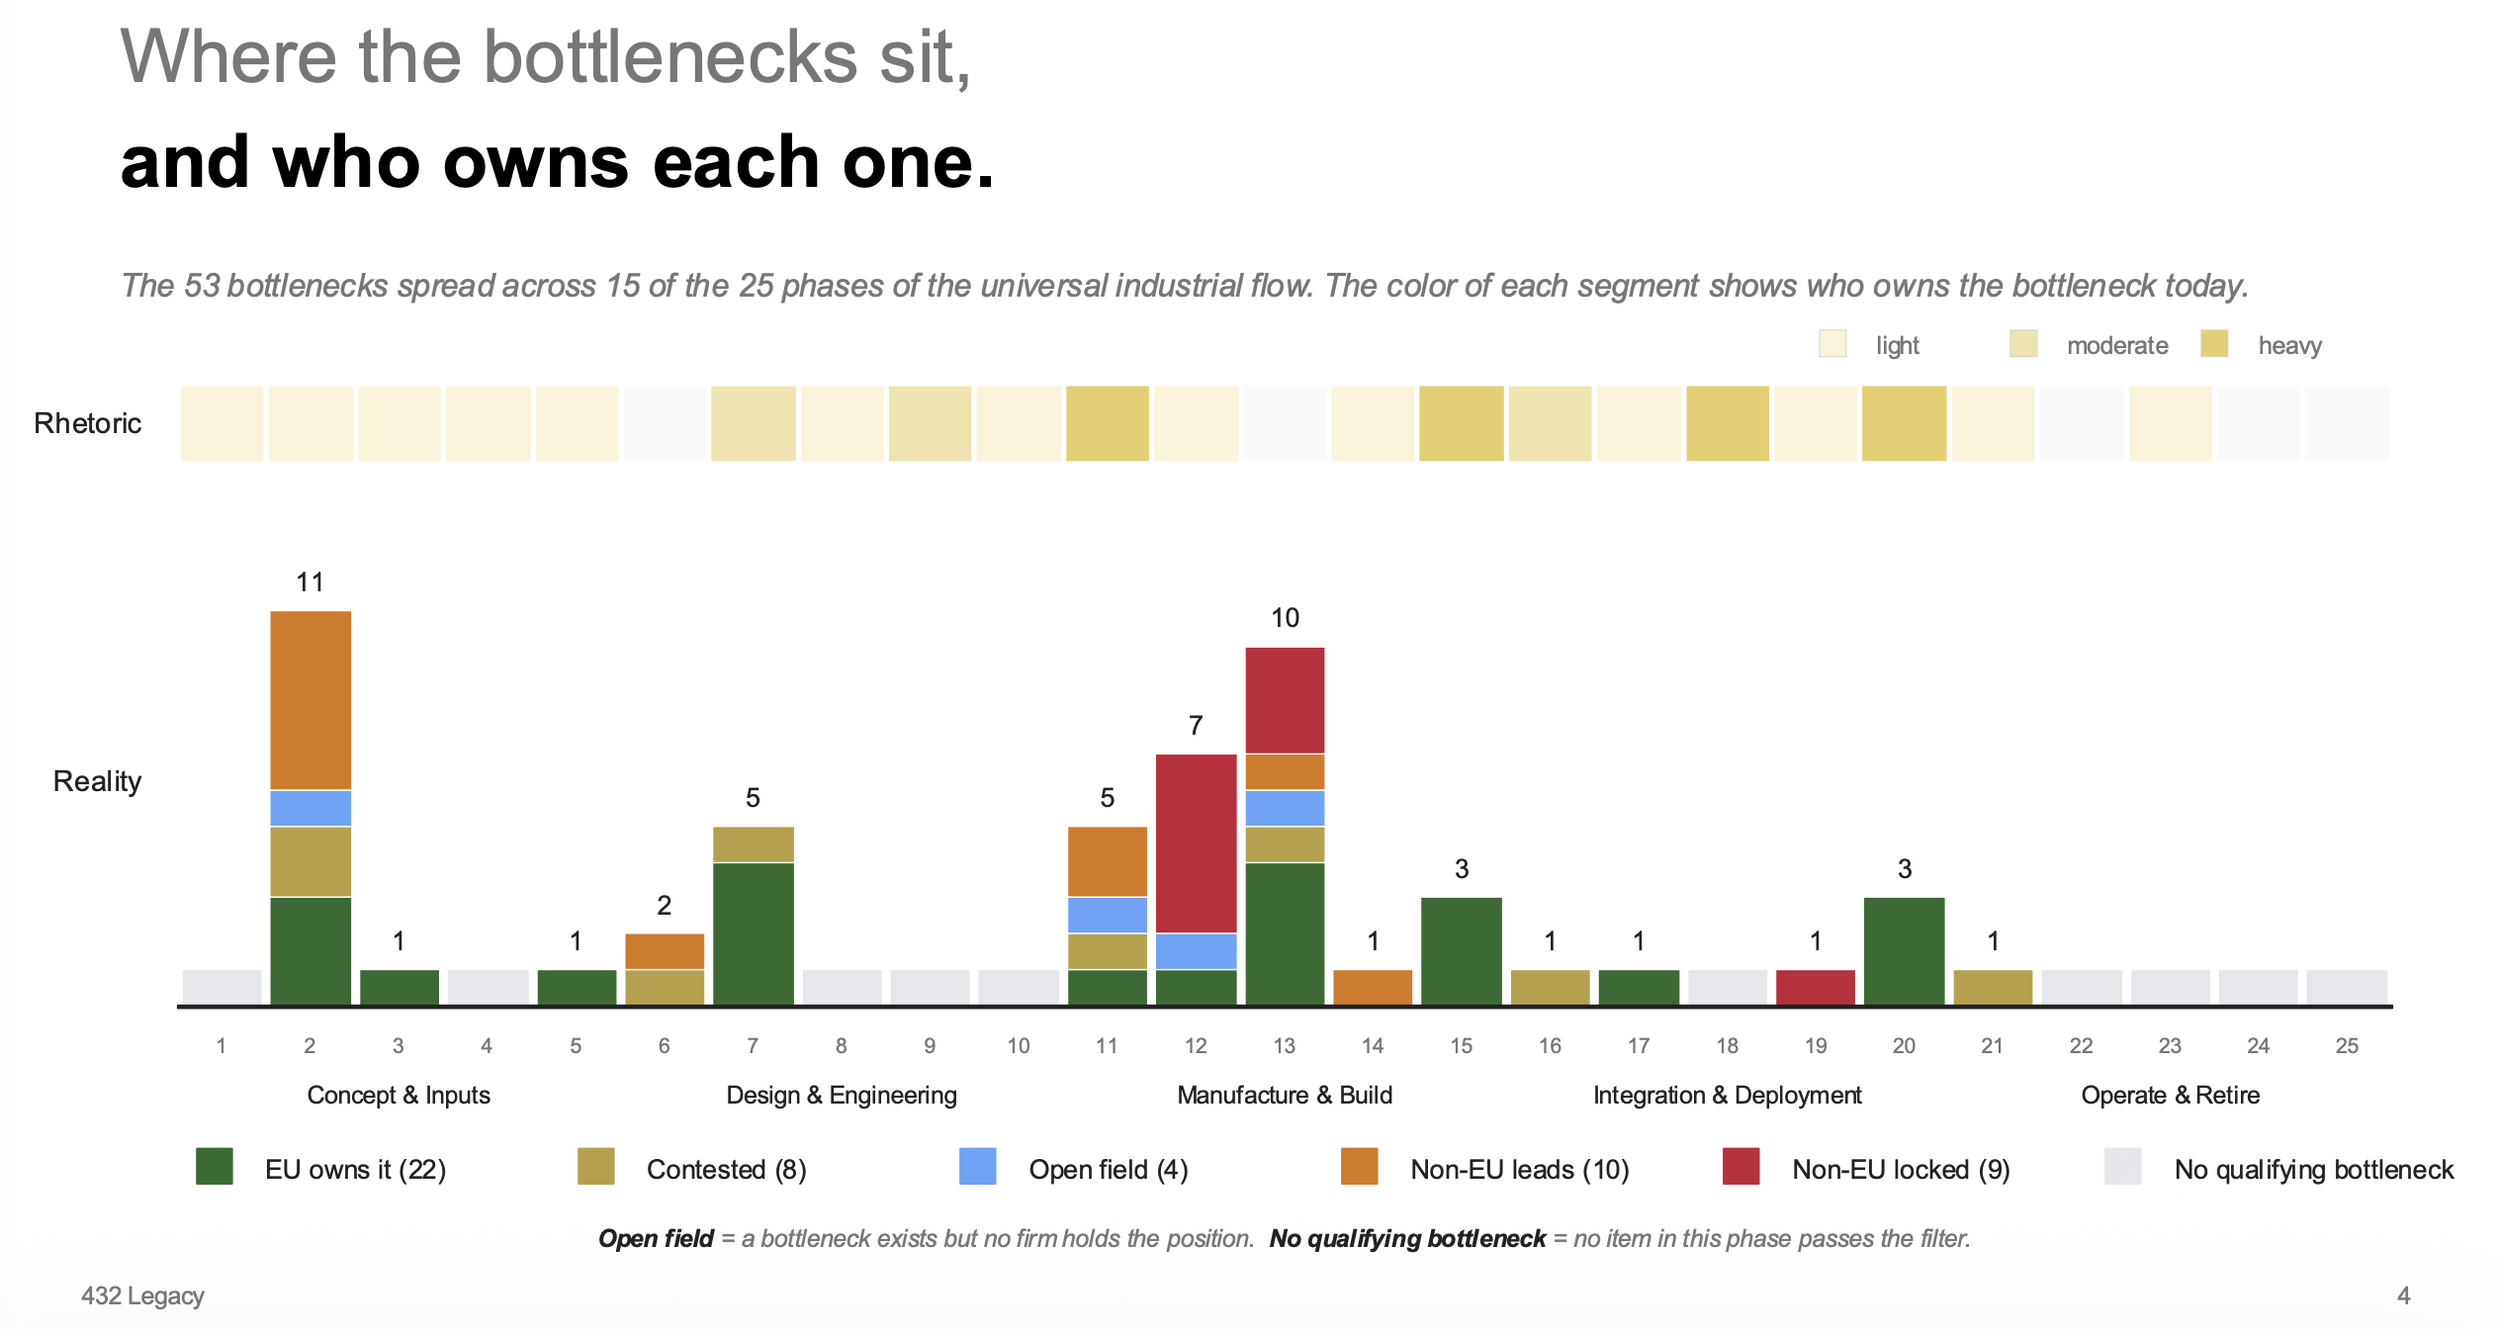
Twenty-two of those fifty-three sit inside European incumbency. Lithography. Grid power. Specialty substrates. ASML, Soitec, Prysmian, Siemens Energy, Hitachi Energy. Europe already wins here.
Nine are structurally locked by non-EU platforms. NVIDIA holds the locks on five storage bottlenecks. TSMC holds two on advanced packaging. Ajinomoto and Nittobo hold one each on packaging materials. Competing on the dimensions incumbents already defend is the wrong move here.
Four are wide open. No incumbent on either side of the Atlantic. 200mm silicon-carbide substrates. Sub-10µm copper-to-copper hybrid bonding. 100G and 200G EML laser chips. EML on indium-phosphide for 800G and 1.6T optical links. The next decade gets decided here.
The rest are contested or trailing.
When we overlay the European funding and policy instruments against the same fifty-three bottlenecks, the two maps point in different directions. The rhetoric concentrates on the parts of the stack where Europe already leads. The bottlenecks sit somewhere else.
That mismatch is the article.
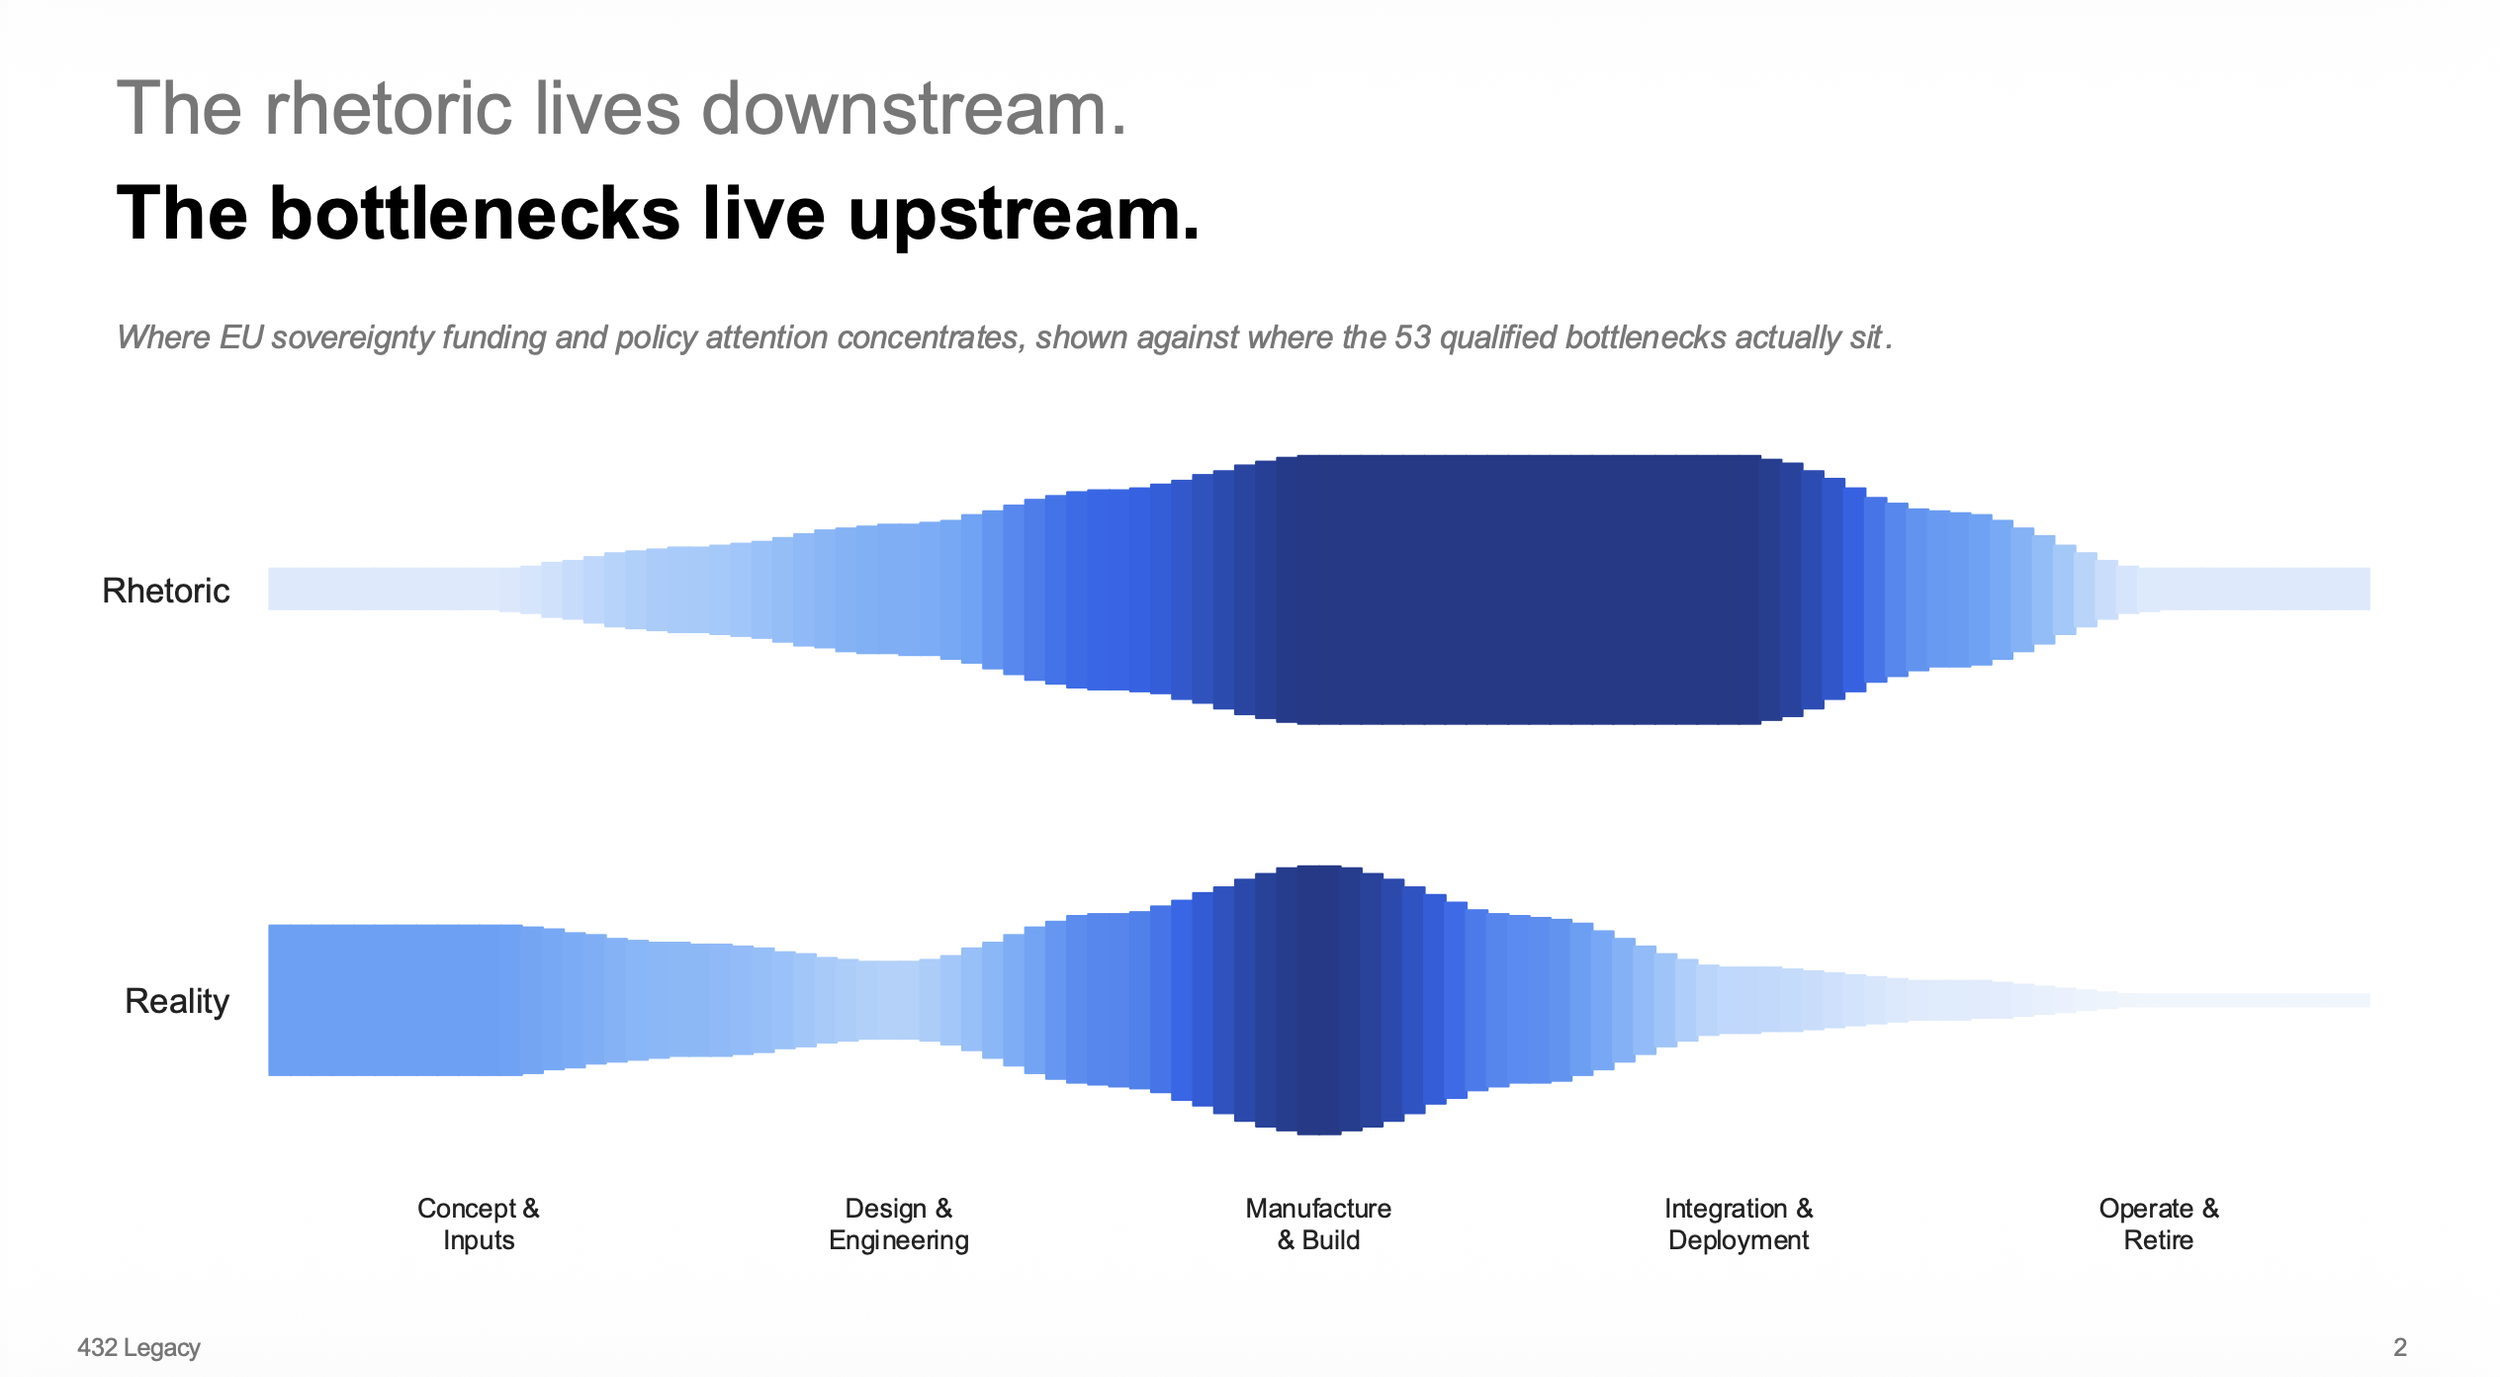
Rhetoric and capital flows are not aligned to where they would matter most.
II. The deeper finding is not geographic
If sovereignty were only a question of where firms are headquartered, the policy response would be straightforward: defend incumbency, build into open fields, route around locks. The map shows something else.
Across all five EU Tech Sovereignty chains, the dominant constraint is deployment, not supply.
The count of nodes blocked by regulation, certification, qualification, market design, or governance rules exceeds the count of physical supply scarcity in every chain. The ratio runs more than thirteen to one in post-quantum cryptography. Five to one in conformity testing. In the power grid chain, the deployment-gated cluster runs to forty-four nodes against seventeen severe supply bottlenecks. The pattern repeats.
Capacity exists. The rails to deploy it do not.
The single longest-duration bottleneck we identified in the entire power chain, the only ten-year-plus item, is a governance rule. European transmission-system-operator grid models, encoded under the Common Grid Model Exchange Specification, are accessible through the Operational Planning Data Environment to TSOs and regional coordination centres. Every non-TSO actor who needs to plan around the grid (data-centre developers, large industrial loads, distributed-storage operators, sovereign AI infrastructure programmes) is excluded by rule. The constraint is who is allowed to read.
This is the European sovereignty problem in miniature. Most of the gates are institutional. Institutional gates do not respond to capacity funding.
III. Six chains, six findings
Power: capacity exists, the queue does not move
The European power grid is the densest competitive field in the corpus. One hundred and four firms carry capability signal across thirteen bottleneck technologies. Europe's transformer Tier-1s (ABB, Siemens Energy, Hitachi Energy, Schneider Electric) and cable specialists (Prysmian, Nexans, NKT) sit at the centre of world supply.
The supply story for hyperscale AI data-centre grid connections reads as constrained. EU effective supply for 110-145 kV oil-filled power transformers in the 60-150 MVA class runs around two to four GVA per year against four to nine GVA per year of data-centre and industrial demand. Lead times average between two and two-and-a-half years, with large units reaching four. Pre-molded 220-400 kV cable joints have a single named EU supplier with the right qualifications.
The funding instruments respond to that supply story. The European Grids Package supports build-out. State-aid frameworks ease investment.
The bottleneck sits beside the supply story. Eighty of the chain's nodes carry an excess-capacity reading on supply and a deployment gate. The gates are interconnection queue management, environmental and land permitting, grid-code commissioning, and market-design choices around fast frequency response and 24/7 renewable matching. Every hyperscale campus in Europe waits years on these constraints. Capacity funding does not move them.
Semiconductors: the centre is hollow
The chain that should be the most-funded by the Chips Act is also the chain with the cleanest contradiction. Europe owns the upstream (lithography, specialty gases, substrate IP) and depends on non-EU suppliers for the downstream (advanced packaging, build-up films, interposers). The funding concentrates on the upstream Europe already owns.
The hardest single number in the chain: refined gallium metal at 6N+ purity, the input feedstock for trimethylgallium and the gallium-nitride and gallium-arsenide epitaxy that follows. China produced approximately ninety-nine percent of the world's primary low-purity gallium in 2024 per the USGS Mineral Commodity Summaries [1]. The refined high-purity stage is more distributed; Canada, Japan, Slovakia, and the United States all participate in refined production. Europe sits near zero on commercial refined output. Chinese export controls escalated twice: the August 2023 licensing regime tightened to a December 2024 in-principle ban on dual-use shipments to the United States [2], with a one-year suspension granted in November 2025. Europe's structural dependency on Chinese refining persists regardless of any temporary lifting. Metlen's Greek Critical Raw Materials Act strategic project targets 50 tonnes per year by 2028 [3].
The four open fields the corpus identifies sit in this chain or adjacent to it. Two-hundred millimetre silicon-carbide substrates. Sub-ten-micron copper-to-copper hybrid bonding. One-hundred and two-hundred gigabit EML laser chips for 800-gigabit and 1.6-terabit pluggables. EML on indium-phosphide for the next generation of the same. European tool vendors (EVG, Besi) and research institutes (imec, CEA-Leti, Fraunhofer IZM) hold the underlying capability. Production-scale qualification does not exist.
The cleanest statement of the contradiction: Europe has approximately zero on-shore qualified commercial production capacity for 300mm silicon interposers in the CoWoS class. TSMC's CoWoS dominates globally; industry-tracked lead times across the AP3/AP5/AP6 backend fabs ran 52 to 78 weeks in Q1 2026, with NVIDIA absorbing approximately 60-70% of total CoWoS capacity allocation [4]. The Chips Act pilot-line programme (APECS) is the explicit policy response. Pilot lines are not qualified production. The Silicon Box facility in Novara, Italy, ships panel-level packaging at smaller scale; full capacity arrives in 2033 [5].
Storage: where Europe integrates rather than builds
This chain decomposes the stack a sovereign AI environment needs to function: memory and storage media, optical and electrical interconnect, server and rack hardware, the fabrics and protocols that carry the bits, the systems software that schedules the work, the security operations and governance that keep data inside European jurisdictional reach.
Three priority bottlenecks sit at sole-supplier status. NDR-class InfiniBand host channel adapter ASICs (NVIDIA ConnectX-7 and ConnectX-8; the IBTA Integrators' List names only NVIDIA NDR switch entries; HHI proxy near 10,000). Quantum-2 InfiniBand switch silicon (NVIDIA platform by definition; Juniper Networks states in its published comparison whitepaper that InfiniBand is sole-sourced through NVIDIA). The production RDMA transport stack for NVMe over Fabrics in EuroHPC environments (NVIDIA Mellanox OFED, with DOCA-OFED succeeding it; the Linux upstream rdma-core path exists at adjacent nodes but is not in production deployment at NDR or HDR speeds in EuroHPC systems including Leonardo, MareNostrum 5, and JUPITER) [6]. Two further bottlenecks sit at dominant-but-contested status: 400/800 GbE RoCEv2 SmartNICs and DPUs (only two vendors advertise AI-fabric-class adapters with GPUDirect-capable data paths at this performance class, NVIDIA BlueField-3 and Broadcom's AI networking line); and NVMe-oF DPU and target cards (NVIDIA BlueField with SNAP holds the only documented production JBOF design win; AMD Pensando Salina and Intel E2100 are named adjacent entrants without comparable design wins) [6]. The shape of the lock varies. The shape of European dependency does not.
Sixty-four percent of all nodes in the chain carry a deployment gate even when supply is fine. The European names in this chain (Atos, Eviden, Bull, Scaleway, OVHcloud) integrate on stack they do not make.
The two highest priority scores in the entire EU corpus sit in this chain. NDR-class InfiniBand HCA ASICs at 9.29. Indium-phosphide O-band laser wafer fabrication and die-to-silicon photonics integration at 9.35. One is a platform lock. The other is one of the four open fields. Europe has the research base; commercial production does not yet exist.
A sovereign AI strategy that does not address fabric silicon runs on a rented control plane.
Industrial robotics and automation: the incumbency Europe is selling
Europe built the global industrial robotics incumbency. Europe is now selling it.
ABB announced on October 8 2025 the divestiture of its Robotics and Discrete Automation division to SoftBank Group for USD 5.375 billion, closing mid-to-late 2026 subject to EU, China, and US regulatory approval [12]. SoftBank framed the acquisition as part of its Physical AI strategy, alongside its existing positions in AI chips (Arm), AI data centers, and energy. ABB Robotics carried USD 2.3 billion of revenue and 7,000 employees in 2024 [12]; the division's global market share had already declined from 12 percent in 2018 to 10.5 percent in 2024 before the sale was announced [12]. KUKA, the German robotics flagship with 2025 revenue of EUR 3.9 billion and 14,542 employees, was acquired by Midea (China) at 94.55 percent in 2016, taken to full ownership by squeeze-out in 2022, and delisted from the stock exchange [13]. Universal Robots, the Danish collaborative-robot leader, has been Teradyne-owned since 2015. The historical "Big Four" of industrial robotics (ABB, KUKA, FANUC, Yaskawa) has had two European members. After the SoftBank-ABB deal closes in 2026, it will have none.
The market is shifting under that ownership. Industrial robotics today is dominated by automotive applications in the installed base. The growth over the next decade concentrates somewhere else: bin picking, FMCG packaging lines, logistics handling, electronics assembly, food processing. The new deployment surface is heterogeneous, smaller-batch, and dependent on modern perception working through certified safe action. The standards corpus that governs this seam reorganised materially in December 2024 with the publication of ISO/PAS 8800, the first standard to treat AI directly as a safety-relevant component in road vehicles, with first certification issued to Geely Auto in 2025 under SGS-TUV Saar [14]. Unplanned downtime in this layer costs a median industrial business USD 125,000 per hour, USD 2.3 million per hour in automotive, and roughly USD 1.4 trillion annually across the Fortune Global 500: eleven percent of revenue, up from eight percent in 2019 [14]. KUKA's CES 2026 partnership with Algorized, announced as the first industrial robot with intuition, is a concrete instance of the convergence happening. The hardware exists. The integration layer between modern perception and certified safe action does not deploy at scale.
Europe still owns the supporting layer. SICK (sensors, German-owned), Stäubli (Swiss, robots and connectors, family-owned), Siemens (automation and motion control), Festo (electric and pneumatic automation), Schunk (grippers), Beckhoff (PC-based controls), Pilz (safety systems), Trumpf (machine tools and lasers), Neura Robotics (new-wave humanoid). The incumbency layer has not vanished. The high-visibility robot-OEM tier has been divested. The structural question is whether the remaining sovereign assets get organised before they follow the same trajectory, or after.
Post-quantum cryptography: the deadline that has already slipped
The European post-quantum transition deadline for member states is the end of 2026. For critical infrastructure, the end of 2030. The European policy timetable is in place. The supply to execute it is not.
As of Q1 2026, no cryptographic module implementing a NIST-standardised post-quantum algorithm (ML-KEM, ML-DSA, or SLH-DSA, per FIPS 203/204/205) had appeared on the CMVP validated-modules list [7]. Several vendors sit on the CMVP Implementation Under Test list with PQC scope: Entrust nShield 5s, Entrust Authority Security Kernel, Thales Luna K7, Thales ProtectServer PCIe HSM 3, Thales Cryptovisor K7, Thales Luna G7, and Securosys Primus [7]. CMVP does not publish review schedules; recent FIPS 140-3 validations have run multiple quarters from submission to certificate. Demand from European qualified trust service providers, sectoral CSIRTs, and NIS2-scope enterprises (approximately one hundred and sixty thousand entities) is regulated, not theoretical.
The same shape repeats one layer down. AgID reported 3.4 billion remote electronic signatures within its qualified trust-services statistics framework in the first half of 2024 (3.5 billion in H2 2023; 3.3 billion in H1 2023) [8]. The European public certification record under EN 419 241-2 (the standard for remote Qualified Signature Creation Devices) shows two commercially certified product families confirmed via the Common Criteria Portal as of Q1 2026: Ascertia ADSS Server SAM v7.0.2 (OCSI Italy, EAL4+, April 2022) [9] and the Entrust Signature Activation Module v1.1.1/2.1 (CCN Spain, EAL4+, June 2025) [10]. Additional national-stack remote QSCDs operate inside member-state trusted-service contexts. The commercially available certified-product set across the EEA is small.
Of the one hundred and forty-three nodes in this chain, forty-one carry a deployment gate combined with a two-year-or-longer resolution duration. Only three nodes hit the qualified-bottleneck filter on supply scarcity alone. The non-tech gate count exceeds the supply gate count by more than an order of magnitude.
Capital deployed into capacity build-out does not clear these gates. The gates are eIDAS conformity assessment capacity, EUCC certification queue depth, ETSI harmonised standards finalization, Common Criteria EAL4+ evaluation cycles, and Trusted List inclusion procedures. Every one of those gates sits on the European institutional layer.
Testing and conformity: the meta-bottleneck
If the previous four chains are sovereignty problems, this chain is the chain that decides whether any of the other four can ever reach market.
It maps the European infrastructure required to take a strategic technology from horizon-scanning through CE marking, post-market surveillance, and end-of-life verification. It serves every product or system that has to pass an EU conformity gate: medical devices under MDR and IVDR, AI systems under the AI Act, batteries under the Battery Regulation, data centre and grid infrastructure, quantum systems, civil cybersecurity products under the CRA, hydrogen and clean-tech equipment.
Twenty-six nodes carry a severe-bottleneck supply reading. Twenty-one of those score below the standard priority-score threshold. The reason is mechanical: the constraints are classified as imminent or potential rather than active. They are designation backlogs, accreditation queues, scope-extension applications, harmonised-standards publication delays. None of them looks like a capacity scarcity. All of them function as one.
The numbers underneath are concrete. European supply of automotive-grade lithium-ion cell pilot manufacturing capacity runs at approximately one hundred and fifty to four hundred megawatt-hours per year against demand of approximately two hundred to one thousand megawatt-hours per year from fifty planned gigafactories. The first commercial full-system optical quantum clock was delivered to PTB by TOPTICA in September 2025; supply runs at one to two systems per year against national metrology institute demand of four to ten. Cryogen-free dilution refrigerators for quantum testbeds: European supply of thirty-five to eighty systems per year against demand of fifty to one hundred and twenty.
These look like equipment shortages. They are also institutional capacity shortages. The Notified Body designation backlog under MDR Annex IX, the harmonised-assessor workflow under the Office of the European Union Publications system, the conformity-assessment-body cohort under the EUCC scheme. Every one of these is a system Europe owns and Europe is choking on.
IV. What changes when you read the map this way
The standard reading of European tech sovereignty treats it as a capacity question. How much wafer fabrication. How many gigawatts of compute. How many gigafactories. The funding instruments are designed to answer capacity questions.
The map reads differently. In four of the five EU Tech Sovereignty chains, the modal constraint is institutional. The fifth, semiconductors, is the one where the industrial constraint is real and the funding is still misaligned: it concentrates on lithography (Europe leads) and pilot lines (qualified production does not follow) rather than on the open fields and the structural import dependencies.
The investable consequences are sharp. Capacity funding does not clear deployment gates. Deployment gates clear when the institutions that built them are engaged, partnered with, or routed around. That requires a different set of moves than equity into a fab.
We have identified, in each of the five EU Tech Sovereignty chains, the bundles where deployment-gate resolution and supply-capacity expansion compound. They are not equally distributed: some chains carry two or three bundles, some carry one. The action shape inside each bundle is different. In some cases capacity license is the move. In others, channel partnership or regulatory shaping. In some, M&A. In a few, direct equity. Six of those bundles are sufficiently developed that we are operating against them now.
One pattern from the sixth chain extends the framework directly. When the ownership of an incumbency layer migrates, as it has in industrial robotics with ABB and KUKA, the policy response and the investment response diverge. Europe still funds capacity build through the CRMA, the Chips Act, and similar instruments. ABB Robotics changes hands for USD 5.375 billion. The question of who eventually owns the certified deployment layer for industrial automation is being answered without explicit policy contestation.
We do not name them in this article.
The reason is straightforward. Specificity is the asset. If you allocate capital into European tech sovereignty without seeing the bundle map, you are funding the rhetoric layer by default. The bundle map is what makes the bottleneck map actionable.

Company origin vs Critical technology coverage: 240 companies - 69 technologies = 16,549 competitive-position assessments
V. Where this lands next
Thomas presents this work at SuperReturn Tech Sovereignty Day in Berlin on Thursday 11 June, 09:05-09:20 main stage. The session, titled "Where will value concentrate next in Europe's technology stack?", opens the day.
What is in the room that is not in this article: the cluster map, the competitive landscape overlay across 240 companies and 69 technologies (16,549 assessed positions), and the action-shape attribution per cluster, including which bundles are best approached through capacity license, channel partnership, regulatory shaping, M&A, or direct equity, and which sit closest to actionability today.
If your mandate includes deploying capital into European technology sovereignty, the question worth answering before the check clears is whether you are funding where Europe already leads or where Europe is actually stuck. The two maps do not overlap. The bundles do.
Joachim Laqueur is Managing Partner of 432 Legacy. Thomas Thurston is General Partner at 432 Legacy and Chief Technologist at Ducera Partners. The full bottleneck map and competitive landscape work referenced in this article will be available as a shareable report following the Berlin presentation.
About the methodology, infrastrucutre and its history: Over 70 venture investments into 42 companies we done by using the computational and global data-harvesting infrastructure 432 Legacy and Ducera Partners run on. Ducera has executed over $900 billion in transactions since founding ten years ago, scaling from zero to roughly $100 billion per year on the back of the computational value-chain infrastructure Thomas has been building since 2015. The underlying methodology, developed over nearly two decades of research begun with Clayton Christensen at Harvard in 2005, identifies where value is migrating across industries: which positions look strategic today but are quietly commoditising, which constraints will compound, and the companies inside those constraints.
Sources
[1] USGS Mineral Commodity Summaries 2026: Gallium. China produced 839,000 kg of 848,000 kg world primary low-purity gallium in 2024 (approximately 99%). Refined high-purity gallium production is more geographically distributed (Canada, China, Japan, Slovakia, United States). https://pubs.usgs.gov/periodicals/mcs2026/mcs2026-gallium.pdf
[2] Chinese Ministry of Commerce Notice No. 46 of 2024 (3 December 2024). Strengthened export controls on dual-use items to the United States; in-principle prohibition of gallium, germanium, antimony, and superhard material exports to U.S. recipients. Escalated the August 2023 licensing-only regime to near-prohibition for U.S.-bound dual-use exports. Partially suspended November 2025 for a one-year period.
[3] Metlen Energy and Metals announcement, 16 January 2025; European Commission CRMA Strategic Project designation, 25 March 2025. 50 tonnes per year gallium production target at the Aluminium of Greece site; staged alumina/gallium start-up from 2027; full operation 2028. https://www.metlen.com/news/press-releases/new-large-scale-mining-metallurgical-industrial-investment-by-metlen/
[4] Silicon Analysts CoWoS lead-time tracking, March 2026: 52 to 78 weeks across TSMC AP3/AP5/AP6 backend fabs. Both CoWoS-S and CoWoS-L fully booked as of December 2025 (TrendForce). NVIDIA holds approximately 60-70% of total CoWoS capacity allocation in Q1 2026. https://siliconanalysts.com/analysis/foundry-allocation-status-q1-2026
[5] Silicon Box, "Open EU Foundry" announcement, Novara, Italy. Advanced panel-level packaging facility (distinct from 300mm wafer-based interposer production). Full capacity scheduled 2033. https://www.silicon-box.com/silicon-box-cutting-edge-advanced-panel-level-packaging-foundry-announces-3-6b-investment-for-expansion-into-italy
[6] NVIDIA's market position across these five bottlenecks is drawn from the 432 Legacy critical-path analysis of the EU Sovereign AI/HPC storage value chain (May 2026 vintage). Sole-supplier classifications (HHI proxy near 10,000, N=1 qualified supplier in public evidence) apply to NDR-class InfiniBand HCA ASICs (Item 333, supported by the IBTA Integrators' List https://www.infinibandta.org/wp-content/uploads/2025/11/PF42-IB-Integrators-List-v1-2025-10-22.pdf and JUPITER procurement specifications), Quantum-2 InfiniBand switch silicon (Item 335, with Juniper Networks "Networking the AI Data Center" whitepaper explicitly stating sole-source status https://www.juniper.net/content/dam/www/assets/white-papers/us/en/networking-the-ai-data-center.pdf), and the production RDMA transport stack for NVMe over Fabrics (Item 328, with Leonardo, MareNostrum 5, and JUPITER all running NVIDIA Mellanox InfiniBand fabric in production). Dominant-but-contested classifications apply to 400/800 GbE RoCEv2 SmartNICs (Item 334, N=2: NVIDIA and Broadcom; https://investors.broadcom.com/news-releases/news-release-details/broadcom-revolutionizes-ai-networking-landscape-high-performance) and NVMe-oF DPU/target cards (Item 338, NVIDIA BlueField-3 the only documented JBOF production design win per Supermicro deployment https://developer.nvidia.com/blog/supermicro-launches-nvidia-bluefield-powered-jbof-to-optimize-ai-storage/; AMD Pensando Salina and Intel E2100 named adjacent entrants). Cross-chain corroboration: EU Tech Sovereignty TEST chain Item 584 describes the combined accelerator-plus-fabric supplier set for EuroHPC AI Factory procurement as effectively one vendor: NVIDIA.
[7] NIST CMVP Validated Modules list and Implementation Under Test list, current as of May 2026. As of Q1 2026, no module on the validated list explicitly enumerates ML-KEM, ML-DSA, or SLH-DSA among approved algorithms. IUT entries with PQC scope include Entrust nShield 5s Hardware Security Module, Entrust Authority Security Kernel, Thales Luna K7 Cryptographic Module, Thales ProtectServer PCIe HSM 3, Thales Cryptovisor K7, Thales Luna G7, and Securosys Primus HSM Cryptographic Module. https://csrc.nist.gov/projects/cryptographic-module-validation-program/validated-modules ; https://csrc.nist.gov/Projects/cryptographic-module-validation-program/modules-in-process/IUT-List
[8] AgID, "Data on Qualified Trust Services available for the first half of 2024." Italian qualified-trust-service-provider statistics under eIDAS supervision: 3.4 billion remote electronic signatures in H1 2024; 3.5 billion in H2 2023; 3.3 billion in H1 2023. https://www.agid.gov.it/en/news/data-qualified-trust-services-available-first-half-2024
[9] Common Criteria certification report: Ascertia ADSS Server Signature Activation Module (SAM) v7.0.2. OCSI Italy, Certificato n. 8/22, EAL4+ (AVA_VAN.5), 29 April 2022. https://www.commoncriteriaportal.org/files/epfiles/cr_adss_sam_702_v1.0_en.pdf
[10] Common Criteria certification report: Entrust Signature Activation Module v1.1.1 and v2.1. CCN Spain, dossier 2020-3-INF-3845, EAL4+ (ALC_FLR.2, AVA_VAN.5), 27 June 2025. https://www.commoncriteriaportal.org/files/epfiles/2020-03-INF-3845.pdf
[11] The 53-bottleneck shortlist, the 22/9/4/10/8 sovereignty classification, the deployment-gate-to-supply-scarcity ratio per chain, and the chain-level statistics (53 bottlenecks across the five EU Tech Sovereignty chains, 684 candidate population, priority and duration filters) draw on 432 Legacy proprietary critical-path analysis, May 2026. The sixth chain (industrial robotics and automation) draws on an adjacent Physical AI value-chain corpus and the public acquisition record cited in [12] and [13]. URL sources at the node level are available in the full report (forthcoming).
[12] ABB Robotics divestiture to SoftBank Group. ABB news release, 8 October 2025: ABB to divest Robotics division to SoftBank Group, enterprise value USD 5.375 billion, closing mid-to-late 2026 subject to regulatory approval in EU, China, and US. SoftBank Group Corp press release, 8 October 2025, framing the acquisition as part of SoftBank's Physical AI focus area alongside AI chips, AI data centers, and energy, complementing existing SoftBank robotics positions (SoftBank Robotics, Berkshire Grey, AutoStore, Agile Robots SE, Skild AI). ABB Group disclosures: Robotics division 2024 revenue USD 2.3 billion, 7% of group, 7,000 employees. Interact Analysis, December 2025: ABB global industrial robotics market share 12% (2018) declining to 10.5% (2024). https://new.abb.com/news/detail/129685/abb-to-divest-robotics-division-to-softbank-group ; https://group.softbank/en/news/press/20251008 ; https://interactanalysis.com/insight/softbank-abb-robotics-ai-investment/
[13] KUKA ownership transition to Midea. Midea Group tender offer August 2016 reached 94.55% of KUKA shares at EUR 115 per share, valuing KUKA at EUR 4.6 billion. Squeeze-out resolved at KUKA Annual General Meeting May 2022; complete acquisition of remaining shares November 2022; KUKA delisted from stock exchange. 2025 KUKA Group revenue EUR 3.9 billion, 14,542 employees, headquartered Augsburg, Bavaria. https://en.wikipedia.org/wiki/KUKA ; https://chinaobservers.eu/after-kuka-germanys-lessons-learned-from-chinese-takeovers/
[14] Standards corpus reorganisation: ISO/PAS 8800 and the industrial-downtime cost baseline. ISO/PAS 8800 published December 2024 under ISO/TC22/SC32/WG14 with input from 17 countries. First standard treating AI directly as a safety-relevant component in road vehicles. First certification issued 2025 (Geely Auto, certified by SGS-TUV Saar). Extends ISO 26262 and ISO 21448 (SOTIF); sits alongside UL 4600 and IEC 61508. Industrial downtime cost figures (USD 125,000/hr median, USD 2.3 million/hr automotive, USD 1.4 trillion annual Fortune Global 500 cost at 11% of revenue, up from 8% in 2019) drawn from 432 Legacy Q1 2026 LP Market Insight on Physical AI Trust and Safety (May 2026), citing ABB Value of Reliability survey 2023 (n=3,215 plant maintenance leaders across 11 industrial sectors) and Siemens True Cost of Downtime 2024.